Case-study: agricultural land around De Zegge-Mosselgoren
Background and objectives
The nature reserve De Zegge is the only remnant of the low moor “Geels Gebroekt” in the Kleine Nete valley. In the 60s, most of this area was drained using a network of ditches to make it suitable for agriculture. The Kleine Nete river was straightened, and the Roerdompstraat was built as a barrier between De Zegge and the agricultural land. Since then, groundwater is pumped out of the agricultural land, so that the water level is deeper than the Kleine Nete river De Becker, 2019. However, in De Zegge and the nearby nature reserve Mosselgoren water tables should be kept as high as possible. Therefore, an auger pump was installed to pump water from the agricultural areas to a peripheral canal to De Zegge Van Diggelen & Grootjans, 2019, where water is kept at an almost constant level. Over the years, the nature reserves became hydrologically isolated from the rest of the Kleine Nete valley. The Kleine Nete valley was characterised by thick peat layers that were gradually reclaimed since the Middle Ages De Becker, 2019 or extracted as an energy source, which was gradually replaced by coal and petroleum Vanierschot, 2014. After land drainage in the 60s, most of the remaining peat was decomposed and lost as Co2 Van Diggelen & Grootjans, 2019.
The nature reserves De Zegge and Mosselgoren are part of the Habitats Directive area “Valleigebied van de Kleine Nete met brongebieden, moerassen en heiden” (BE2100026) and the Birds Directive area “De Zegge” (BE21000424) De Becker, 2019. De Zegge consists of 115 ha, which are mostly owned and fully managed by the Royal Zoological Society of Antwerp (KMDA) Van Diggelen & Grootjans, 2019. The Flemish government has established a number of conservation objectives and priorities for the protection of these areas. However, concern was raised recently that the nature reserves are gradually deteriorating. In addition, climate change is causing an increased occurrence of droughts, further causing pressure on the species depending on wet conditions. Van Diggelen & Grootjans (2019) and De Becker (2019) pointed out to the pumps and canals for land drainage as the reason of deterioration, although Wyseure (2022) asked for a thorough geohydrological study to substantiate a number of assumptions.
Such a study was previously commissioned by the Agency for Nature and Forests and was awarded to the Witteveen+Bos engineering office (“Ecohydrological study: basis for restoration measures for De Zegge Nature Reserve” ). This study first develops a numerical geohydrological groundwater model in order to simulate phreatic groundwater levels, among other things. That model is calibrated with measurements in monitoring wells in the area. When this calibration has been completed, it can be assumed that such a model is the best estimate of the current groundwater flows and level in the entire area, as it is currently managed, with the uncertainties that are always associated with it. Subsequently, this numerical model can also be used to predict the consequences of changing one or more water management measures in the area: switching off pumps or installing or removing weirs. In this way, predictions can be made of the impact of certain measures on groundwater levels.
Full hydrological isolation of the nature reserves from the activities the agricultural areas is not possible in practice, since groundwater remains connected between the two areas via the subsurface. A hydrological isolation would be a very expensive project with underground hydrological screens or other very far-reaching engineering measures, which is not desirable from a practical and financial point of view In order to restore and conserve the nature reserves, De Becker (2019) proposed to rewet the area in the north of De Zegge and the Mosselgoren by raising the average groundwater level by ± 60 cm. Van Diggelen & Grootjans (2019) recommended to stop the pumping in the agricultural polder in the North of De Zegge and raise groundwater levels to ground level. Both studies concluded that agriculture would not be possible anymore under these remediation strategies.
That is why the Department of Agriculture and Fisheries of the Flemish government commissioned this study in 2022 to develop a model framework to assess the impact of groundwater levels on agricultural activities in the area around De Zegge - Mosselgoren. Unfortunately, an analysis of different future groundwater level scenarios was ultimately not possible within the foreseen time due to strong delays in the “Ecohydrological study: basis for restoration measures for Nature Reserve De Zegge”, carried out by the engineering office Witteveen+Bos, commissioned by the Agency for Nature and Forests. However, we used the preliminary results of their calibrated groundwater model ( version December 2022) for the current situation, to showcase how the modelling framework can be used in this area.
Methodology
Study area
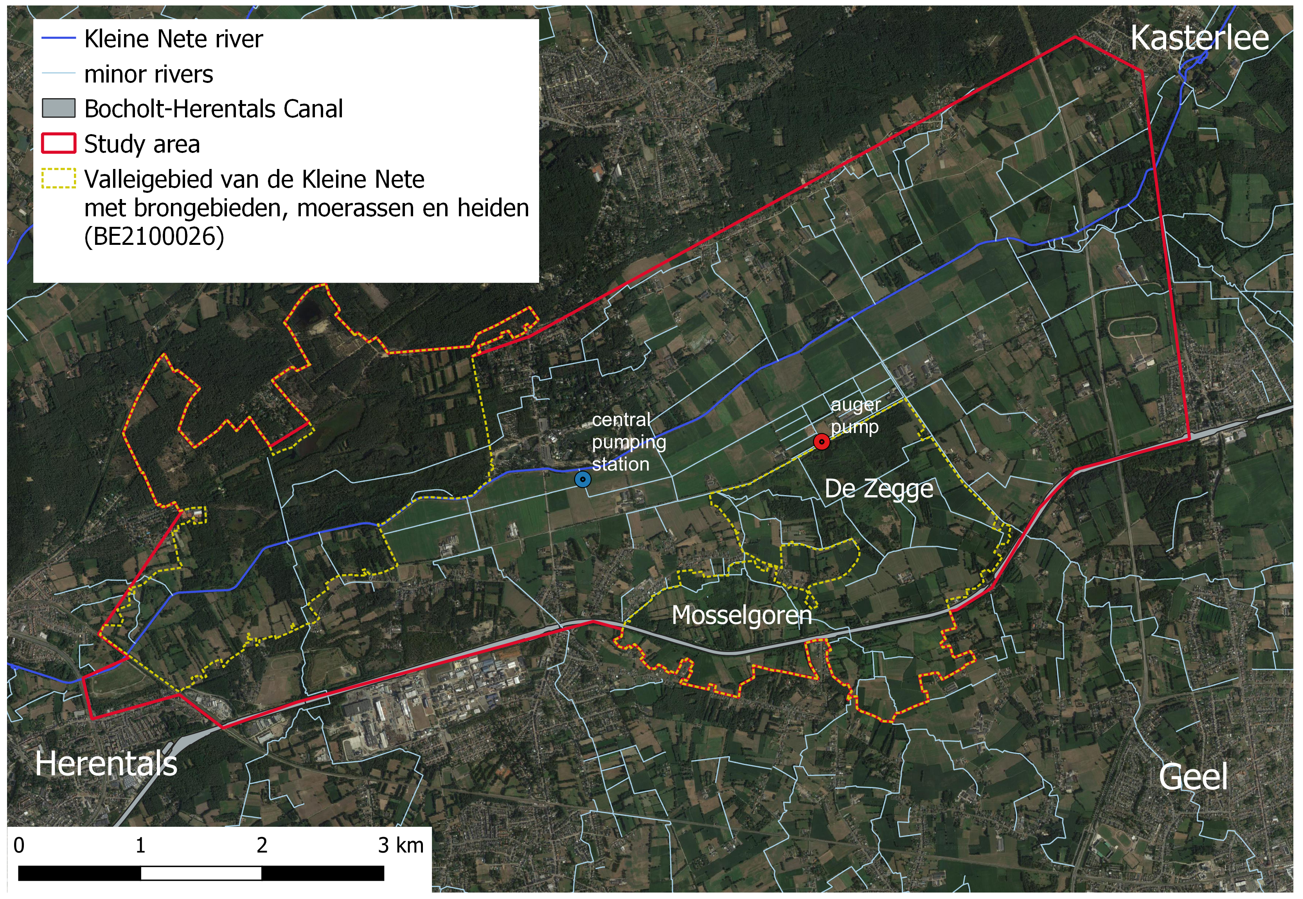
Figure 1:Location of the study area, which includes the Habitats Directive Area “Valleigebied van de Kleine Nete met brongebieden, moerassen en heiden” (BE2100026), canals, rivers and location of the central pumping station and auger pump.
The study area covers approximately 2802 ha and is located in the northeast of the province of Antwerp, in the surroundings of Geel (Figure 1). Hydrologically, the area is located in the Kleine Nete valley, with the Bocholt-Herentals canal in the south. The study area includes the Habitats Directive Area “Valleigebied van de Kleine Nete met brongebieden, moerassen en heiden” (BE2100026), where the nature reserves De Zegge and Mosselgoren are located. These reserves are surrounded by agricultural land. A central pumping station located at the north border of De Zegge ( 51° 11’ 52.62" N, 4° 54’ 26.98" E) allows the drainage of the agricultural lands, and an auger pump ( 51° 12’ 2.06" N, 4° 56’ 8.53" E) pumps the water from the agricultural ditches back to the nature reserve De Zegge (Figure 1, Figure 2). The average monthly precipitation ranges from 30 mm in April and to 78 mm in August, and the average temperature varies between 19 °C in July and 4 °C in January (Joint Research Center (JRC), 2010-2021).
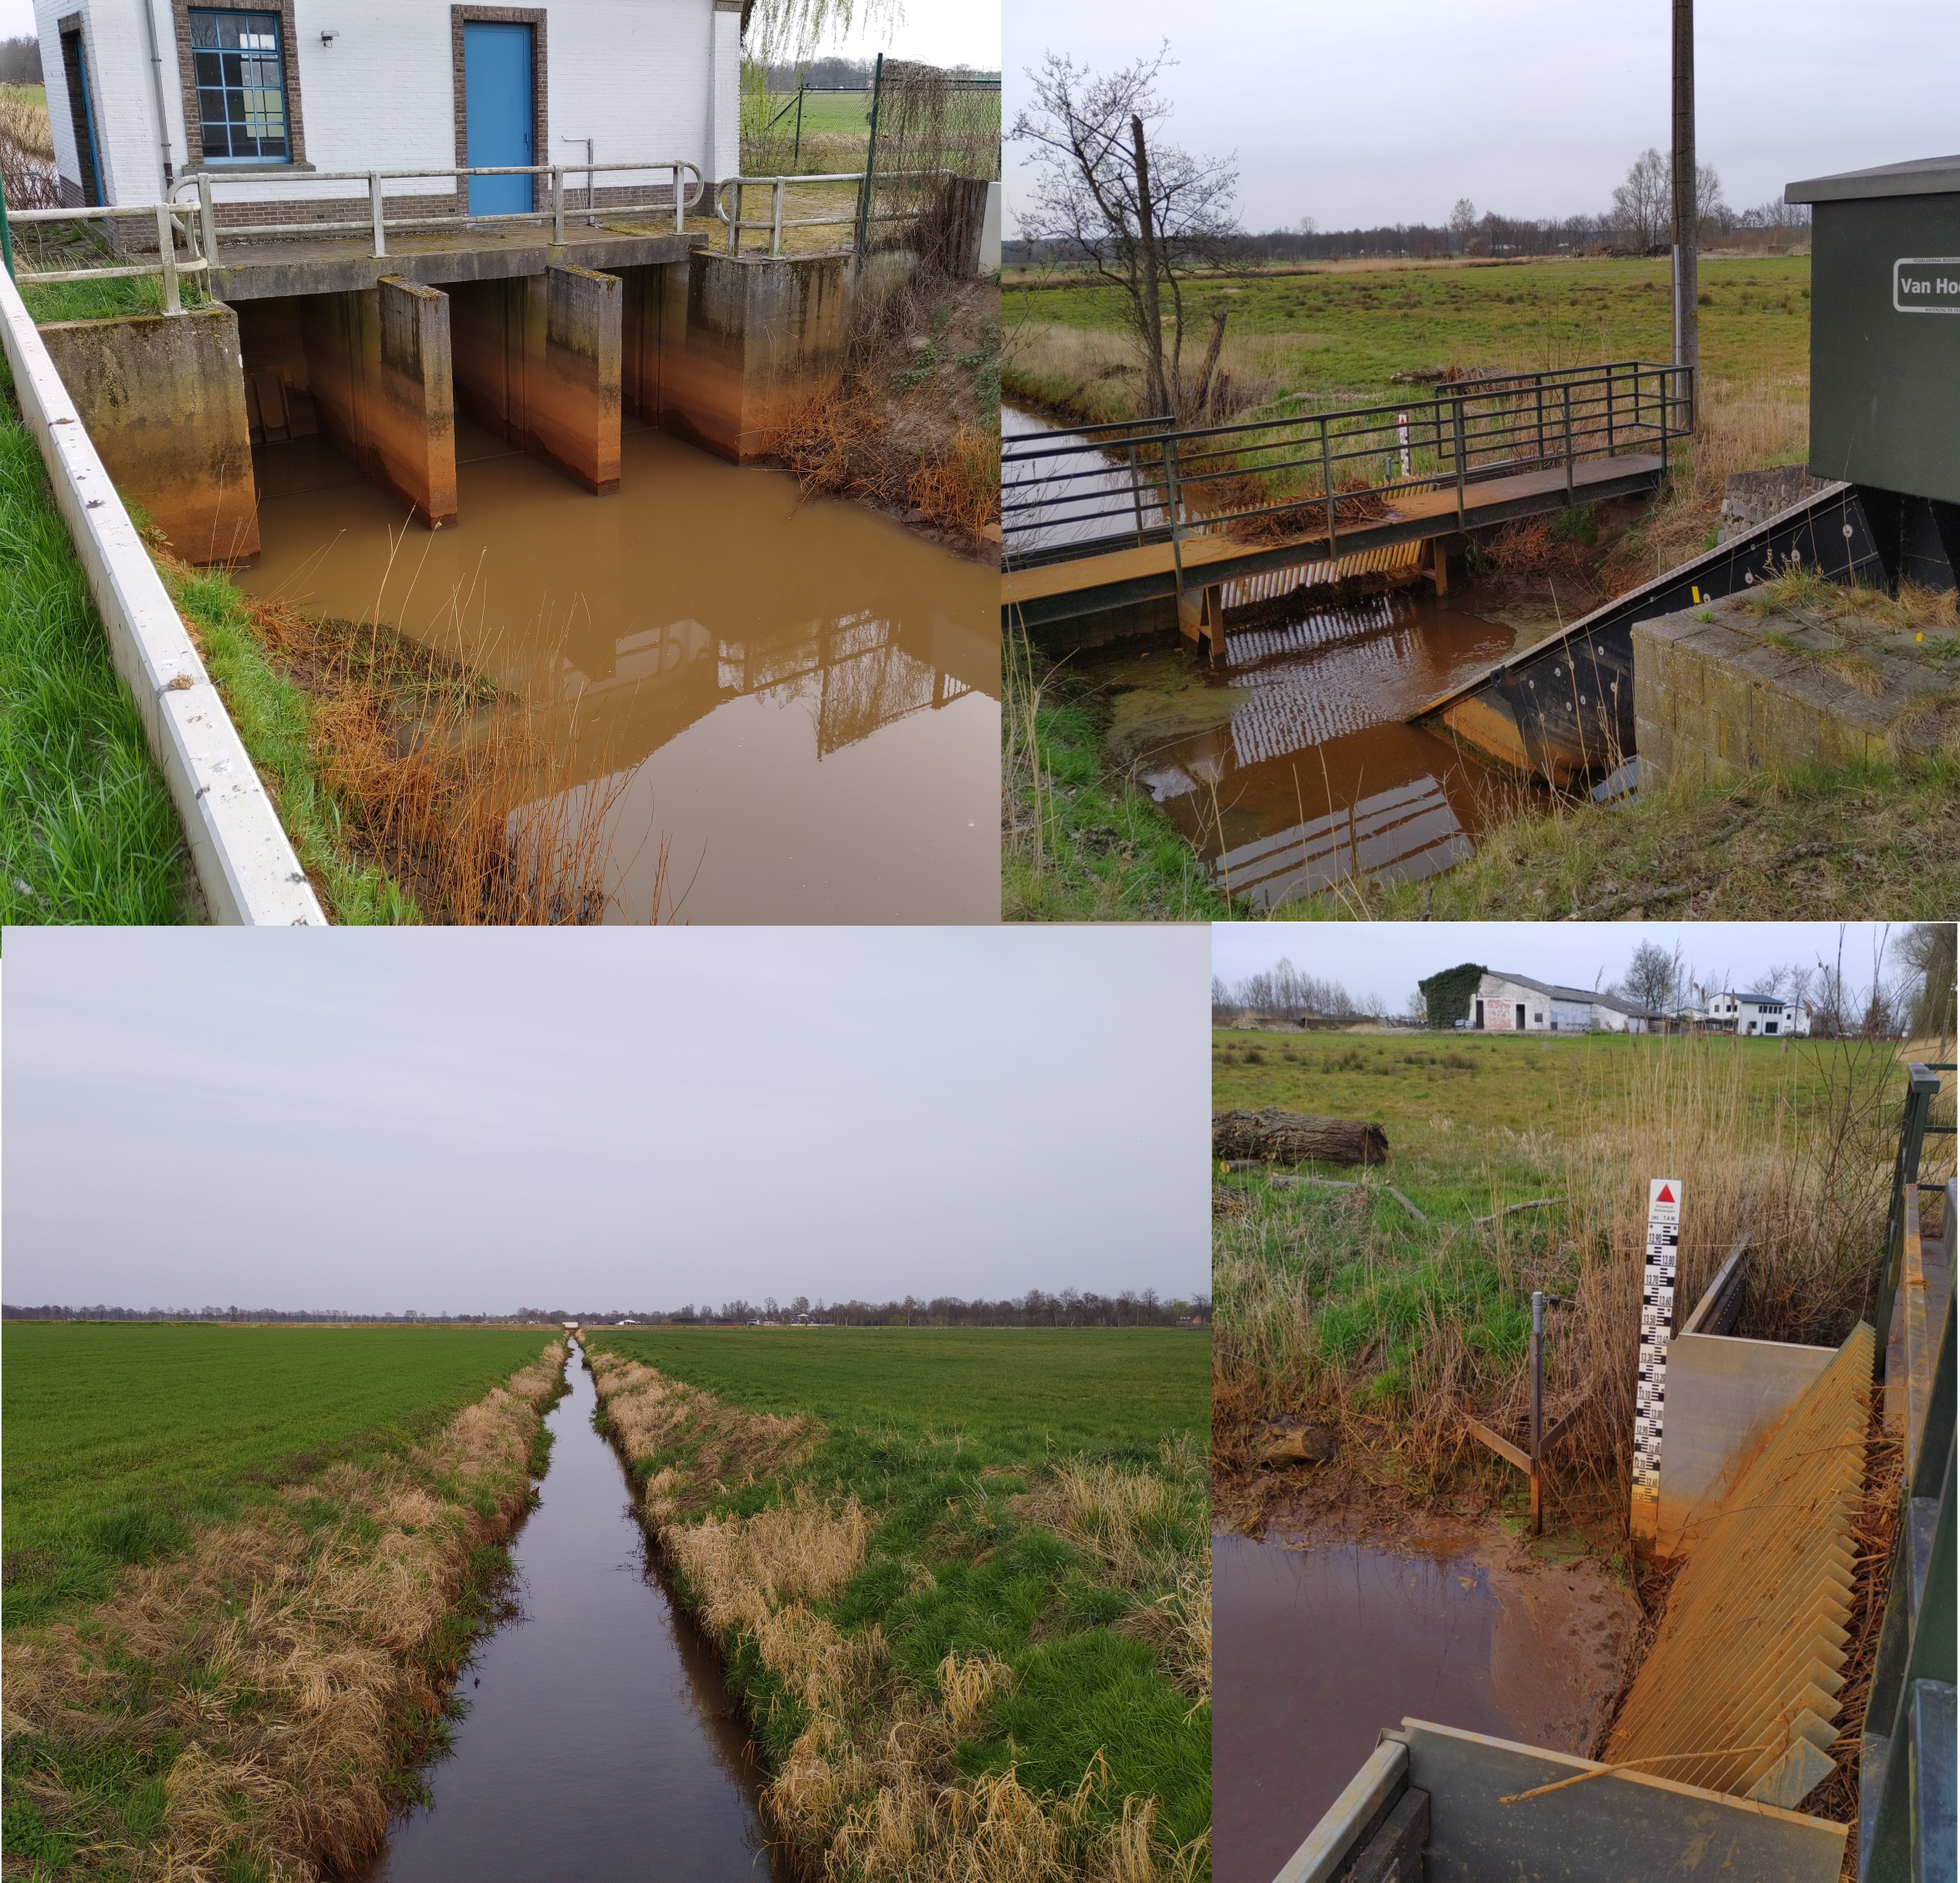
Figure 2:Overview images of the agricultural land, central pump house, auger pump and water level measurement at the auger pump.
Agriculture
According to the ‘agricultural use map’ of 2021 LV, 2021, the main crops cultivated in the study area are grass (41%), silage maize (24%), clover (11%), grain maize (7%), and potato (6%).
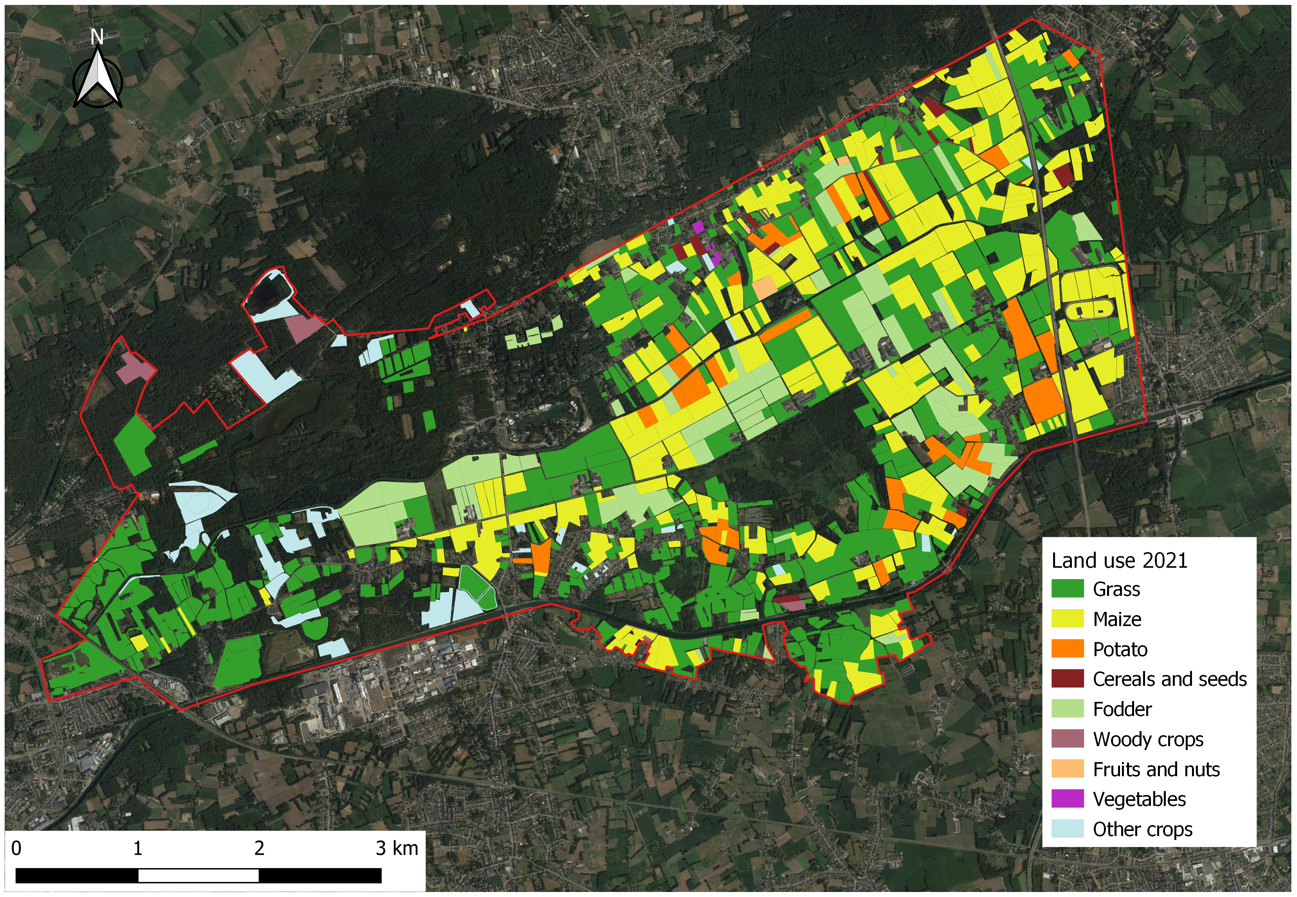
Figure 3:Agricultural use in 2021 in the study area.
Soil texture
The soil texture in the study area is dominantly sand and loamy sand according to the Digital Soil Map of the Flemish region VPO, 2017. Before the drainage of the area in 1960, the soil was mainly sand/peat or peat Van Diggelen & Grootjans, 2019. After drainage of the land, most of the peat was decomposed, and currently peat still exists in the nature reserve De Zegge. For detailed mapping of peat extent and thickness, radiometric data could be combined together with optical satellite data, as in O'Leary et al. (2023). The soil profiles available for modeling, presented in the chapter Model framework to evaluate the suitability of groundwater regime for crop growth section 3.3.1, have a lesser level of detail and do not contain information of peat in this area (Figure 5).
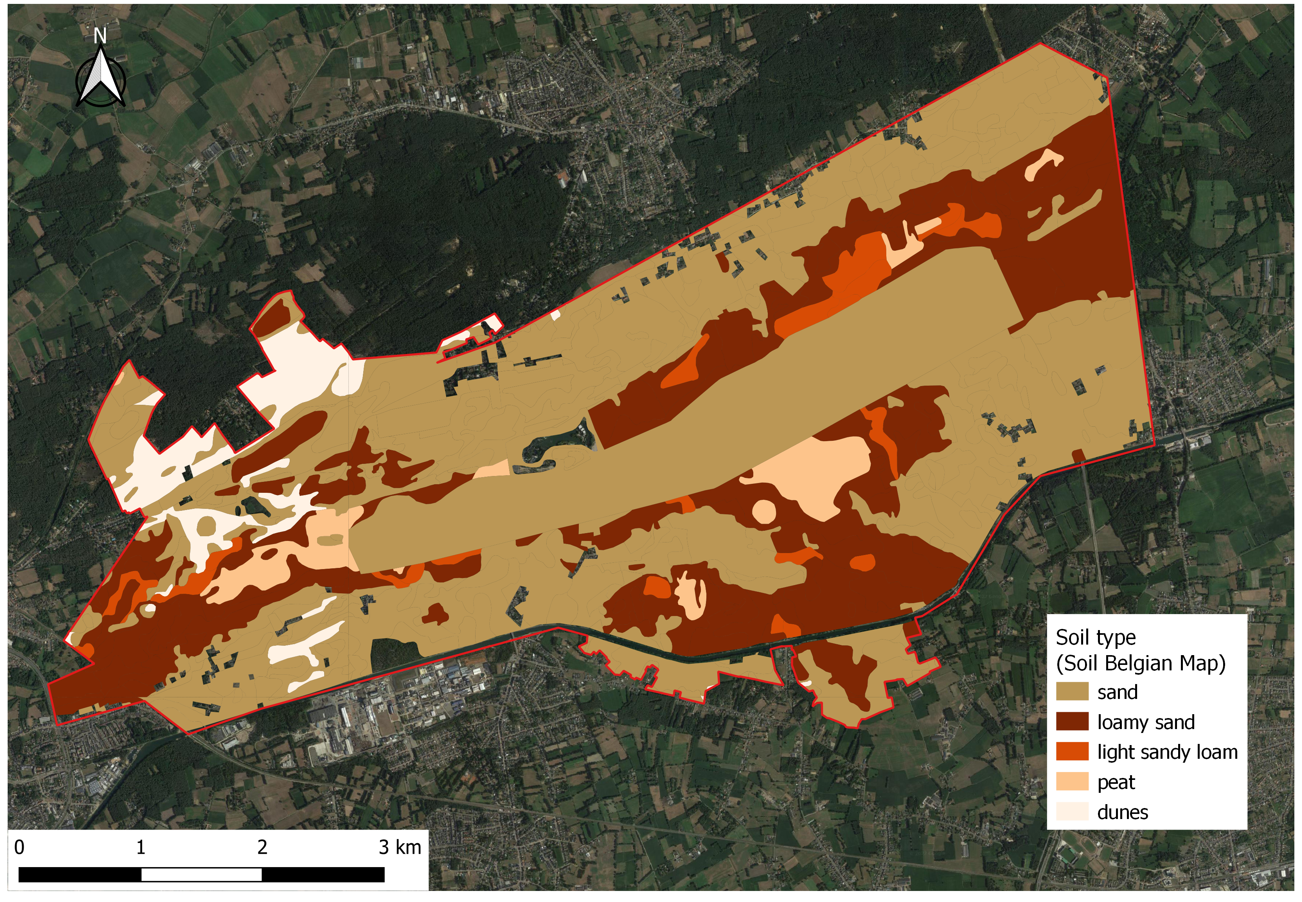
Figure 4:Soil texture in the study area according to the Digital Soil Map of the Flemish region.

Figure 5:Soil texture in the study area according to the soil properties used in the model.
Groundwater
The map below (Figure 6) shows the average groundwater level in the study area (preliminary results of the ecohydrological study by Witteveen+Bos, December 2022). It shows that in the current state, average groundwater levels in the natural areas are shallower than 50 cm (dark green). In the agricultural area north of the Zegge predominantly between 50 cm and 100 cm deep (light green) and in the higher agricultural area also deeper than 100 cm (light orange). This corresponds to the observations from a previous study by Backx et al. (2012) in the period 2005-2010, where the measured average groundwater levels in the agricultural areas were between 90 cm and 150 cm, and less than 30 cm in the nature area De Zegge. Throughout the study area of the ecohydrological study, average groundwater levels do not go deeper than 300 cm anywhere, fluctuating on average between 50 cm in winter and 110 cm in summer based on the average highest groundwater levels (GHG) (Figure 7) and average lowest groundwater levels (GLG) (Figure 8).

Figure 6:Average groundwater levels in the study area based on the preliminary results of “Ecohydrological study: basis for restoration measures for Nature Reserve De Zegge” (Witteveen+Bos). Please note that these are not final results and the report of this study should be consulted for further use.

Figure 7:Average highest groundwater levels (GHG) in the study area based on the preliminary results of “Ecohydrological study: basis for restoration measures for Nature Reserve De Zegge” (Witteveen+Bos). Please note that these are not final results and the report of this study should be consulted for further use.

Figure 8:Average lowest groundwater levels (GLG) in the study area based on the preliminary results of “Ecohydrological study: basis for restoration measures for Nature Reserve De Zegge” (Witteveen+Bos). Please note that these are not final results and the report of this study should be consulted for further use.
The detailed rewetting scenarios were not yet available at the end of this study. It is clear that if a groundwater rise of 60 cm is realized over the entire agricultural area north of the Zegge (as proposed in De Becker (2019)), this would result in a groundwater level just below or even above the soil surface. In the western part of the agricultural area around the Roerdompstraat, this would locally even result in water more than half a meter above the soil surface. It is therefore necessary to obtain more realistic and detailed scenarios for the area in order to subsequently estimate the impact on agriculture.
Van Diggelen & Grootjans (2019) reported 20 groundwater extractions in close proximity to De Zegge. Most of these abstractions are small, in the order of 10000 m3 yr-1, and a few are larger than 25000 m3 yr-1. According to the information of the licenses granted for the extraction of groundwater available in the DOV webportal, there are curently 27 active groundwater extractions inside the study area, mostly smaller than 20000 m3 yr-1. More information on this will probably be available in the ecohydrological study.
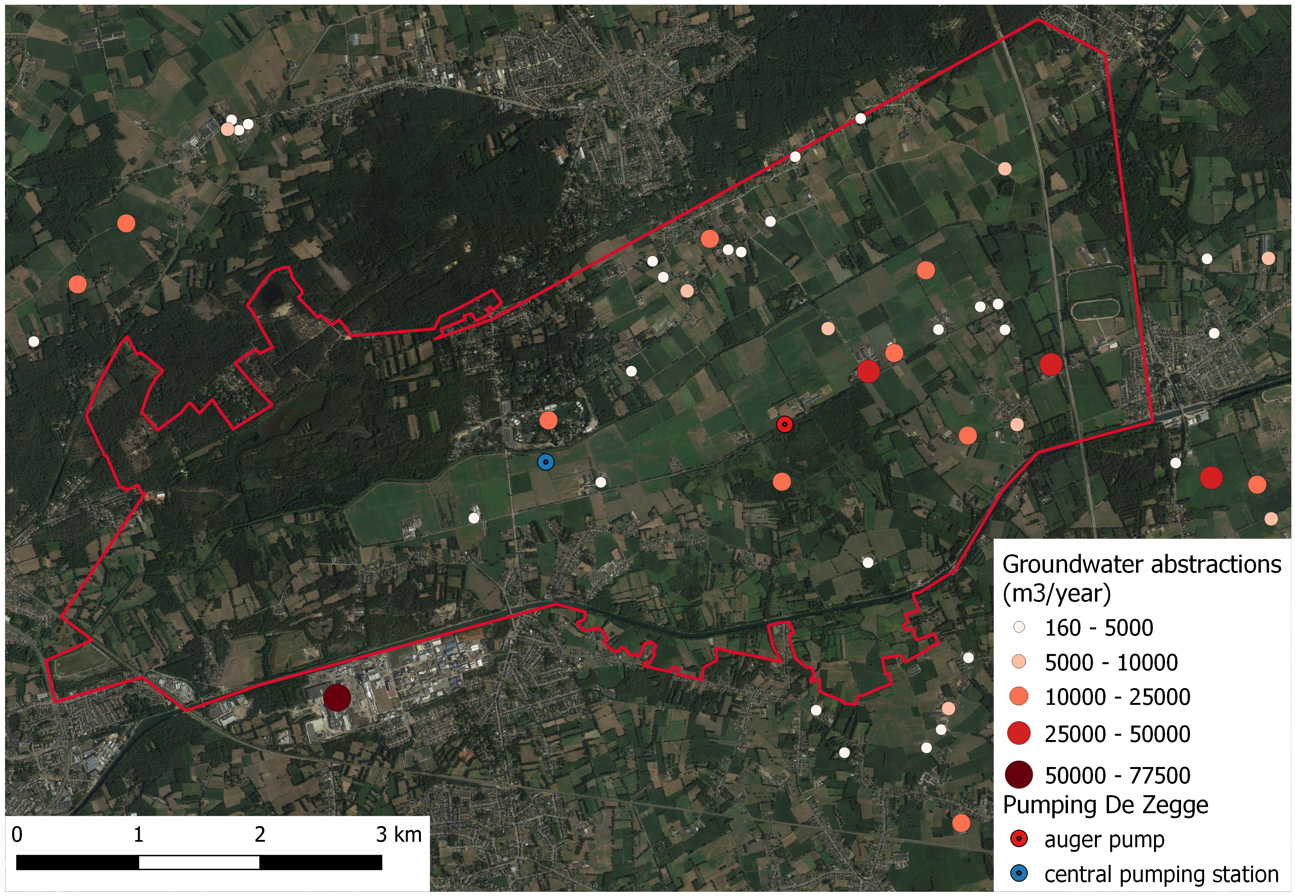
Figure 9:Current groundwater abstractions in the study area. Source: DOV
Model framework
The model SWAP-WOFOST was applied at field level, following the methodology and using the input data layers described in the chapter Model framework to evaluate the suitability of groundwater regime for crop growth. We could not carry out a model calibration and validation, since no historical data series of yield are available for this area. In total, 1282 simulations were performed for a homogeneous crop cover over the study area (Figure 10), every one corresponding to each agricultural parcel. These simulations were conducted for grass and silage maize, which are the dominant crops in the area (65 % of the agricultural area). The model output variables of interest were crop yield and yield reduction due to water stress (too wet or too dry) and indirect effects attributed to wet conditions such as reduced workability and machinability, and planting and harvest delays, which causes a shortening of the growing season.

Figure 10:Location of the SWAP-WOFOST simulations. Each dot represents one model run.
Results and Discussion
The following results include the analysis of the current average situation, based on historical weather conditions and soil information as in the regional analysis, but with groundwater levels simulated with a locally calibrated groundwater model (Ecohydrological study Witteveen+Bos) for the period 2010 - 2021 (following the methodology explained in section 3.4.1 of the modelling framework ). More details about how the current groundwater levels were obtained can be found in the ecohydrological study of Witteveen+Bos. In principle, this represents the current situation, including the operation of the pumps, canals and central pumping station in the agricultural area north of De Zegge up to the Kleine Nete.
Meteorological conditions
The precipitation deficit (P-ET0) in the study area from 2010 until 2021 is presented in Figure 11. Positive values mean excess or sufficient water availability, and negative values indicate insufficient water availability. In general, more precipitation falls in this region compared with the average in Flanders. Therefore, 2016 and 2021 are wetter, and the period 2018 -2020 is less dry.

Figure 11:Yearly precipitation deficit (P-ET0
) in the study area, for the period 2010 - 2021.Yield, yield reduction and type of stress
Figure 12 shows the average simulated dry matter yield for grass and silage maize for the period 2010 - 2021, together with the standard deviation of the actual yield (Yact) depicted with black bars, and the yield reduction due to water stress and indirect effects. The simulated potential yield (grey) represents the yield in that year under prevailing weather conditions, but ideal soil moisture conditions (no stress). The simulated actual yield (green) represents the harvest with the prevailing groundwater level on a particular plot (here the current situation as obtained with the calibrated groundwater model of the ecohydrological study). On the right we see the relative yield reduction ( ) expressed in %. The colors represent the relative share of the different stress types in the yield reduction of a specific year. For this we assume that the yield reduction is proportional to the reduction in transpiration (T). The yield reduction expressed in % for each stress type is then (drought stress, red), and (oxygen stress, blue). For example, in 2015 for the case of silage maize, the maximum potential yield and actual yield were respectively 17.9 ton ha-1and 14.2 ton ha-1. The difference between these two values expressed in percentage results in 20.5 %, which is accounted for by 4.1 % in dry-drought stress, 10.4 % in wet-oxygen stress and 6.0 % in indirect effects.
The model simulations shows a high yield variability through the years, specially in 2011-2012, 2014-2016 and 2021. For the critical years 2015 (normal), 2018 (dry), and 2021 (wet), the grass dry matter yield is on average 11.9 ton ha-1, 13.8 ton ha-1, and 12 ton ha-1respectively, and the silage maize yield is 14.2 ton ha-1, 16.6 ton ha-1 and 13.7 ton ha-1, respectively. The average dry matter yield in Belgium, all soil types mixed, is around 13.5 ton ha-1 for grass ILVO, 2022, and 14.8 ton ha-1for silage maize (with 65 % dry matter yield) STATBEL, 2022.

Figure 12:Inter-annual yield variation and yield reduction for grass and silage maize as simulated by SWAP-WOFOST. The graphs on the left show the average potential (Ypot) and actual (Yact) yield in ton ha-1 from all simulations. Ypotrepresents the maximum potential yield (see section 2.3.2 of the modelling framework). The black bars represent the standard deviation of the actual yield between the different plots. The figure on the right show the relative yield reduction (REDTOT= REDdir+REDind =(Ypot-Yact / Ypot)*100+REDind) expressed in %. The colors represent the relative share of the different stress types in the yield reduction. For this we assume that the yield reduction is proportional to the reduction in transpiration (T). The yield reduction expressed in % for each stress type is then (Tdry/(Tpot-Tact))*REDdir(drought stress, red), and (Twet/(Tpot-Tact))*REDdir(oxygen stress, blue).
There is a high temporal yield variability, especially in silage maize, which has to do mainly with the high yearly variability in weather conditions in the region (and in Flanders). The actual or attainable yield (light green) is quite high when compared with the potential yield (light grey) in most years, and the overall yield is higher in dry years than in wet years. This shows that the agricultural water management provides optimal conditions for this activity in most situations, which is consistent with what local farmers experience. However, it is a delicate equilibrium. Reductions in wet periods are related to the shallow water table in the study area, which causes oxygen stress (blue color in the figure) in crops when there is excess rainfall. In grass, the average yield reduction is always below 30 % and is largely caused by oxygen stress (too wet conditions). In silage maize, yield losses rise up to 50 % in 2016, and around 30 % in 2021, and are also predominantly caused by oxygen stress. The growing season in 2016 was characterized by wet conditions during spring and dry conditions during the next months (Figure 13) which caused suffocation of the root system and soil acidification at the start of the season and made the crop more vulnerable to drought in the next months. Indirect effects ( brown) in silage maize are more significant than in grass, although they do not cause more than 7 % of yield reduction.

Figure 13:Cumulative precipitation deficit (P-ET0) during 2016. The period May - October is highlighted in the plot. The blue line represents the cumulative P-ET0 in the study area while the black line indicates the average cumulative P-ET0 in Flanders of all years combined (2010-2021).
Relation between yield reduction and groundwater level
Figure 14 shows the relation between the average groundwater levels on each individual parcel (as simulated by the calibrated groundwater model of the ecohydrological study for current water management) and total yield reduction for 2015, 2018, and 2021, for grass and silage maize. The dots in the back denote the simulation results for the three years in all parcels. The colored lines describe the average relation based on the simulations of each year (2015-green/normal, 2018-red/dry, 2021-blue/wet). This makes it clear that the optimum groundwater level is not only determined by the soil and cultivation, but also by the weather. In the wet year 2021, for example, the maximum yield occurs with a lower groundwater level than in the dry year 2018. The yield decreases sharply in all years with groundwater levels above 80 cm.

Figure 14:Correlation between average groundwater levels and total yield reduction, in 2015, 2018 and 2021, for grass and silage maize. The dots in the back denote the simulation results for the three years, and the colored lines represent the average relation based on the simulations of each year. The black line represents the average relation of all simulated years combined from 2010 to 2021.
The intersections between the colored line of each year and the horizontal black dotted lines illustrate the effect on yield in dry and wet years, for the situations of shallow groundwater (50 cm) and deeper groundwater (200 cm). For a shallow groundwater level of 50 cm, the yield reduction is lower in a dry year and higher in a wet year. The opposite occurs with a deeper water table of 200 cm, where the yield reduction is much lower in a wet year. In many locations where the water table is shallower than 50 cm, crop yield is still significant but with low rentability. With small increases in groundwater level, yield is drastically reduced to levels where cultivation is not profitable anymore. These relationships can slightly vary for different weather conditions and also depend on the specific properties of distinct crop varieties. In this study, we did not distinguish between varieties within a crop and only compared crops among themselves.
In the current situation, based on the results of a ~10-year period, field management and groundwater level control in the area are optimal for agricultural activities (grass and silage maize), especially in dry years, but already results in limitations in wet years. This is evident from the simulations, but also from discussions with the farmers themselves during workshops in 2022. Should the water table rise due to rewetting measures like the ones proposed in previous studies Van Diggelen & Grootjans, 2019De Becker, 2019, this will certainly have consequences for the profitability of the current crops on the agricultural lands north of the Zegge. After all, the above figure clearly shows that when groundwater levels exceed 50 cm, the harvest decreases drastically.
Next steps: impact of rewetting scenarios
In the future, the modeling framework developed in this study can be used to assess the impact of different groundwater level scenarios on conventional agricultural crops. In concrete terms, these scenarios will be generated with the calibrated groundwater model from the ecohydrological study. After all, this model can be used to calculate the impact of shutting down pumps or other measures and to simulate how this will affect groundwater levels in the entire area. The simulated groundwater levels for different scenarios can then be used to calculate the impact on agricultural crops with this model framework.
Conclusions
The SWAP-WOFOST model was applied at field level in the study area around De Zegge-Mosselgoren to evaluate the yield variability of grass and fodder maize. This was done using the current groundwater levels as obtained with the calibrated groundwater model from the ecohydrological study, and with the same model input as described in the Model framework to evaluate the suitability of groundwater regime for crop growth.
Differences in meteorological conditions between the years cause a large yield variability over the years, especially for silage maize. Shallow groundwater levels in the study area cause oxygen stress in crops in wet years, but are beneficial for crop production in dry years. In general, oxygen stress is the main cause of yield reduction in this area. The total yield reduction due to too dry or too wet conditions and indirect effects (shorter growing season) is up to 30% for both crops at the current groundwater levels and the current climate, except for silage maize in 2016 where there was up to 50 % yield reduction, mainly due to oxygen stress.
In the current situation, agricultural water management in the area is optimal for agricultural activities in dry years, but already causes restrictions in wet years. This corresponds to the practical experience of the farmers involved in the area. Detailed conclusions about the effect of rising groundwater levels as a result of rewetting strategies on agriculture in the study area cannot yet be drawn from this study, as the scenarios were not yet ready. This can be evaluated in the future on the basis of the groundwater level scenarios from the “Ecohydrological study: basis for restoration measures for Nature Reserve De Zegge” with the model framework elaborated here. The model SWAP-WOFOST adapted for the Flemish conditions and corresponding documentation is freely available in the PEILIMPACT github repository.
- De Becker, P. (2019). Ecologisch onderbouwde scenario’s voor moerasontwikkeling en hydrologisch herstel in De Zegge en Mosselgoren [Techreport]. Instituut Natuur- en Bosonderzoek (INBO). https://www.vlaanderen.be/inbo/publicaties/ecologisch-onderbouwde-scenario-s-voor-moerasontwikkeling-en-hydrologisch-herstel-in-de-zegge-en-mosselgoren
- Van Diggelen, R., & Grootjans, A. P. (2019). Bedreigingen en herstelmogelijkheden van het KMDA reservaat “De Zegge”, Onderzoeksgroep Ecosysteembeheer, ECOBE 019-R233 [Techreport]. https://pure.rug.nl/ws/portalfiles/portal/80198493/Experteninschatting_Ecohydrologie_Zegge_1_.pdf
- Vanierschot, L. (2014). Soil organic carbon in the landscape: relation with natural and anthropogenic gradients in the Campine region. 10.13140/RG.2.1.3085.7446
- Wyseure, G. (2022). Beschouwingen over de Zegge.
- LV, D. (2021). Landbouwgebruikspercelen. https://www.geopunt.be/catalogus/search?facet=Dataset\&filters=W3siTmFtZSI6IklTT0NBVEVHT1JZIiwiVmFsdWVzIjpbIjExMUZBNUU1NEVBMDRFMjVCQTVBMzQzRjk1M0I0RTUyIl19XQ%253d%253d\&Page=1